What the Q3 2026 South Bay Apartment Market Numbers Show
This South Bay apartment market report for Q3 2026 covers sales volume, pricing, asking rents, vacancy, and the new construction pipeline across the South Bay multifamily market.
Apartment pricing is holding in a narrow range
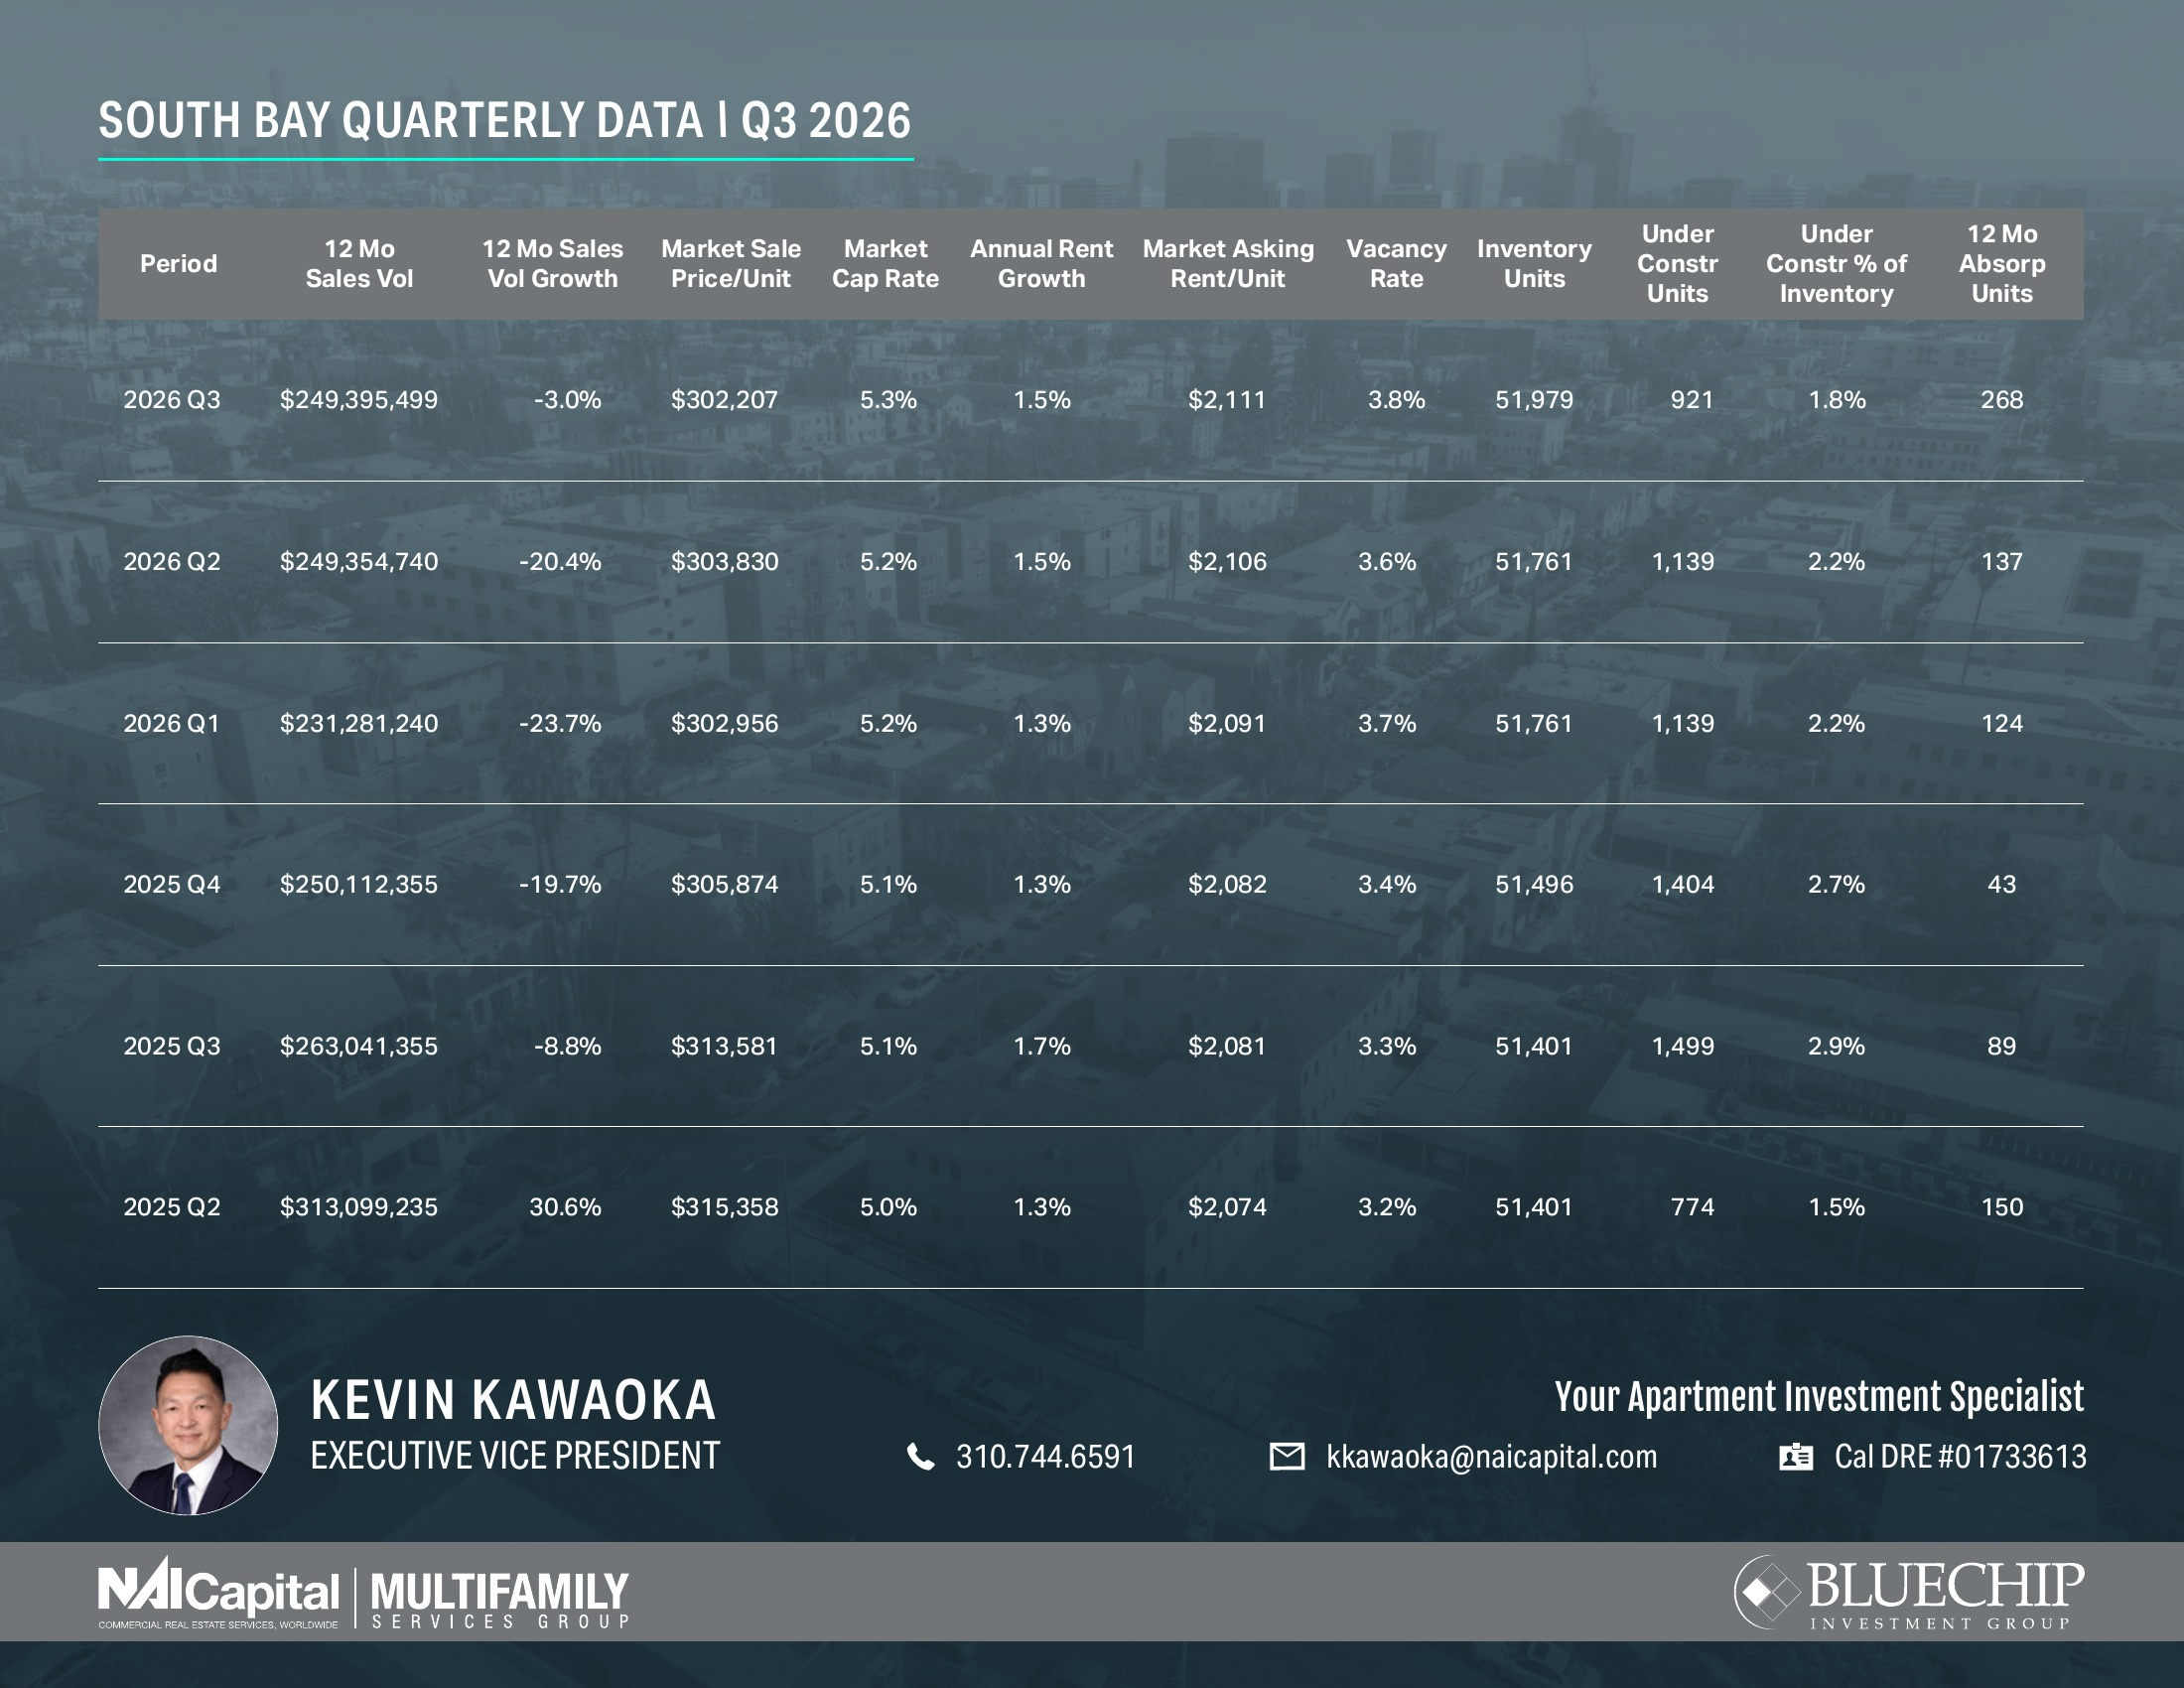
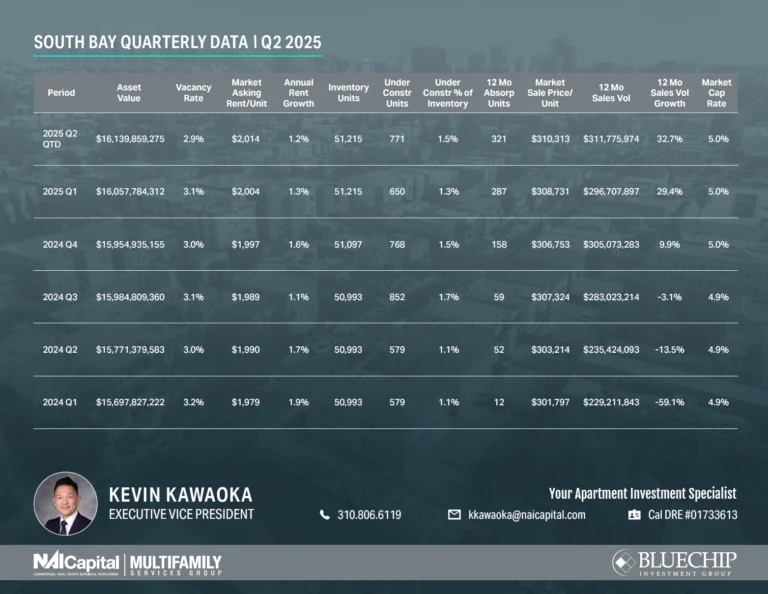
The average market sale price for South Bay apartments was $302,207 per unit in Q3 2026, compared with $303,830 in Q2 and $302,956 in Q1. Pricing has now stayed within about $1,600 per unit for three straight quarters, after sliding from $315,358 per unit in Q2 2025. Year over year, the average price per unit is down about 3.6%.
Multifamily sales volume is leveling off
Trailing 12-month sales volume totaled $249.4 million, down 3.0% from $263.0 million a year earlier. That is a much smaller decline than the double-digit drops recorded in each of the prior three quarters.
Compared with last quarter, volume was essentially unchanged at $249.4 million and remains above the $231.3 million low recorded in Q1 2026.
Apartment demand picked up sharply
Net absorption—the number of apartment units newly occupied—reached 268 units over the past 12 months. That is nearly double the 137 units reported last quarter, about three times the 89 units of a year ago, and the strongest result in the last six quarters.
Average asking rents reached $2,111 per month, up from $2,106 last quarter and $2,081 a year earlier. Annual rent growth held at 1.5% for the second consecutive quarter.
South Bay apartment vacancy edged up to 3.8% from 3.6% last quarter and 3.3% a year ago. That increase lines up with new deliveries: the South Bay’s inventory grew by 218 units this quarter to 51,979 apartments, and by 578 units over the past year—more than the 268 units absorbed over the same period.
The new-apartment supply pipeline continues to shrink
Apartments under construction fell to 921 units, down from 1,139 last quarter and well below the recent high of 1,499 units in Q3 2025. The pipeline now represents about 1.8% of existing inventory, compared with 2.9% a year ago.
As these projects are completed, fewer new units are scheduled to enter the market, which means less new supply competing with existing apartment buildings for renters.
What this means for South Bay apartment owners and investors
Market cap rates averaged 5.3% in Q3 2026, up from 5.2% last quarter and 5.1% a year ago—about 20 basis points higher year over year. Buyers are pricing in higher yields while rents continue to grow, demand is strengthening, and the construction pipeline is shrinking.
The Q3 2026 data shows per-unit pricing holding in a tight range, sales volume leveling off, stronger absorption, and a smaller supply pipeline, with vacancy moving up while recently delivered units are absorbed.
Where an individual building falls within these benchmarks will depend on its age, location, unit mix, condition, and how its current rents compare with the South Bay market average of $2,111 per month.